* Introduction blatantly copied from mattdm’s Five Things in Fedora This week post in Magazine .
” Fedora spends quite a bit of energy, time, money, and other resources on Fedora’s presence at conferences. But, it’s unclear how much this actually matters — does it bring in new Fedora users? What about contributors? Well, over on the CommOps team, contributor Bee Padalkar set out to figure out. As I discussed in my State of Fedora talk at Devconf.cz, a lot of the activity in Fedora infrastructure generates messages on fedmsg — it’s like Twitter for all of our systems talking to each other, rather than for humans.
Bee starts by looking at attendees who got the FOSDEM 2016 Badge at the Fedora booth there, and then observing their activity after the conference. Accounts which start at the conference and then become ongoing, active contributors = measurable conference success. Read about this on the CommOps list, and stay tuned for more analysis of other conferences, and of course my favorite — pretty graphs.* ” — mattdm
This article tries to measure the impact of FOSDEM – especially in terms of newcomer onboarding and contributor retention in Fedora. I start by looking at the attendees who claimed the FOSDEM Badge[1][2] [3] at the Fedora Booth.
FOSDEM Participation
Number of Fedora Contributors who attended FOSDEM 2016 : 76 out of which 19 were newcomers onboarded during the event.
Number of Fedora Contributors who attended FOSDEM 2015 : 52 – unfortunately, no newcomers were onboarded during FOSDEM 2015.
Number of Fedora Contributors who attended FOSDEM 2014 : 52 out of which 9 were newcomers onboarded during the event.

The number of past FOSDEM attendees coming back to attend FOSDEM is also interesting.
In FOSDEM 2015, 19 attendees out of 52 had previously attended FOSDEM (from FOSDEM 2014). In 2016, 21 contributors from FOSDEM 2015 attended FOSDEM 2016. Overall in 2016, 28 contributors out of 76 had attended FOSDEM in the past. There are 10 Fedora contributors who are regular FOSDEM attendees – 2014,2015,2016 . We can obviously see that the popularity of FOSDEM has increased amongst Fedora contributors – especially those who have attended the event in past. Also, number of newcomers onboarded in FOSDEM 2016 was significantly greater than previous years – about one third of existing contributors who attended FOSDEM 2016 !

Contribution Activity
Contribution Activity during FOSDEM
FOSDEM 2014
Highest fedmsg Activity by Fedora contributor during event : 698 messages (gnokii)
Lowest fedmsg Activity by Fedora contributor during event : 0 messages (2 contributors)
Mean fedmsg Activity by Fedora contributor during event : 25 messages
Median fedmsg Activity by Fedora contributor during event : 5 messages
Mean fedmsg Activity by newcomer during event : 7 messages
Median fedmsg Activity by newcomer during event : 8 messages
FOSDEM 2015
Highest fedmsg Activity by Fedora contributor during event : 6219 messages (pbrobinson)
Lowest fedmsg Activity by Fedora contributor during event : 0 messages (17 contributors)
Mean fedmsg Activity by Fedora contributor during event : 125 messages
Median fedmsg Activity by Fedora contributor during event : 2 messages
(No newcomers were onboarded during FOSDEM 2015)
FOSDEM 2016
Highest fedmsg Activity by Fedora contributor during event : 6968 messages (pbrobinson )
Lowest fedmsg Activity by Fedora contributor during event : 0 messages (5 contributors)
Mean fedmsg Activity by Fedora contributor during event : 99 messages
Median fedmsg Activity by Fedora contributor during event : 5 messages
Mean fedmsg Activity by newcomer during event : 13 messages
Median fedmsg Activity by newcomer during event : 12 messages
The median is a more representative measure for measuring overall activity of existing Fedora contributors during FOSDEM as it is not affected by extreme values in data. The high number of fedmsgs generated by pbrobinson during FOSDEM 2015 and 2016 had led to an increase in the overall mean , while the median remains almost the same. Overall, FOSDEM 2014 and 2016 show higher activity than FOSDEM 2015.
It is interesting to note that
- Every Fedora newcomer has had some contribution activity during FOSDEM apart from just claiming the FOSDEM badge (unlike existing contributors).
- The median fedmsg activity of newcomers during FOSDEM has been higher than that of of existing Fedora contributors during FOSDEM .
- Existing Fedora contributors have a vast difference between their mean and median activities during FOSDEM suggesting highly unequal distribution of contribution activity during the event. This is unlike the case of newcomers who have very similar mean and median values i.e. overall similar contribution activity during their initial onboarding.
As we can see till now , FOSDEM 2016 has been a success for Fedora in terms of participation , newcomer onboarding as well as contributions during the event.
Post FOSDEM Contribution Activity
I measured the contribution activity of FOSDEM attendees over short term i.e. one month as well as long term i.e. one year pre and post the event to understand how the conference has impacted their work .
Apart from generating visualizations for comparing the pre event and post event activity(both short term and long term), I also tried to classify contributors according to their pre and post event activity to quantify any increase/decrease in their contribution pattern. For this , contributors was divided into different categories based on their fedmsg activity i.e. 1. low activity contributors (<10 contributions in a month or < 100 in a year) , 2. moderately active contributors(10 -100 contributions in a month or 100 – 1000 in a year) , highly active contributors(100 – 500 contributions in a month or 1000 – 5000 in a year ) , super *awesome* ninja contributors (> 500 contributions in a month or >5000 contributions in a year). I looked for ‘jumps’ by contributors from one activity group to another.
Other than that, I also tried to find correlations in contribution activity to answer the following questions :
- Consistency of Contributions : How correlated is the short term activity and long term activity of a contributor ?
- Correlation of contribution Activity during the event to future behavior
- Impact of Event on Activity : Correlation between pre and post event activity
To understand this, I used Pearson correlation coefficient and p-value as a measure.
The Pearson correlation coefficient measures the linear relationship between two datasets. Like other correlation coefficients, this one varies between -1 and +1 with 0 implying no correlation. Correlations of -1 or +1 imply an exact linear relationship. Positive correlations imply that as x increases, so does y. Negative correlations imply that as x increases, y decreases.
The p-value roughly indicates the probability of an uncorrelated system producing datasets that have a Pearson correlation at least as extreme as the one computed from these datasets.
FOSDEM 2014
Short Term Contribution Activity of FOSDEM 2014 attendees
Find the datagrepper charts link here . The timeline is from one month before the event till one month after the event. Notably, the middle of the timeline shows a peak denoting FOSDEM.

Long Term Contribution Activity of FOSDEM 2014 attendees
The timeline is from one year before the event till one year after the event. Hence, the middle of the timeline or 12 months from the start denotes FOSDEM 2014 .

While the activity just after FOSDEM seems to have decreased, a huge amount of activity seems to have been generated starting from five months after the event. However, it needs to be investigated further if this is due to impact of FOSDEM or due to any infrastructure or other changes perhaps.
Activity of Newcomers Onboarded from FOSDEM 2014
9 Newcomers were onboarded during FOSDEM 2014.
Find the datagrepper charts link here. The timeline is from the ending of FOSDEM till one year afterwards. It is important to note that out of 9 newcomers onboarded during FOSDEM 2014 only one continued contributing post the event. This graph hence denotes activity of only one newcomer. It is also important to note the scale of fedmsg activity here – the messages are too less(<15) over the year though there has been an immediate surge in activity post FOSDEM.

Patterns in User activity for FOSDEM 2014
Consistency of Contributions : How correlated is the short term activity and long term activity of a contributor ?
Correlation between short term activity and long term activity (pre FOSDEM activity) : 0.29194433524400315 P value : 0.035724116013432963
Correlation between short term activity and long term activity (post FOSDEM activity) : 0.21466778695361466 P value : 0.12645318597081681
Correlation of contribution Activity during the event to future behavior
Correlation between event activity and Short Term Activity Post event : 0.21503645664240145 P value : 0.12578747089809081
Correlation between event activity and Long Term Activity Post event : -0.03127131151557708 P value : 0.82581453809443239
Impact of Event on Activity : Correlation between pre and post event activity
Correlation between pre and post event Short Term Activity : 0.84370827747699251 P value : 4.0876708021516965e-15
Correlation between pre and post event Long Term Activity : 0.054556575463531362 P value : 0.70087773348995186
The correlation coefficient values for activity of FOSDEM 2014 contributors are too low and hence, inconclusive except for the correlation between pre and post event Short Term Activity. Short term activity before and after FOSDEM for contributors is highly correlated and also has a very small p-value. I do not derive conclusions from these values as they may have been affected due to huge amount of activity generated five months from FOSDEM 2014 which can be due to infra changes.
Activity wise Contributor Classification of FOSDEM 2014 attendees
Short Term Activity

Out of 52 contributors who attended FOSDEM 2014, 10 contributors had an increase in their activity immediately after FOSDEM and jumped ‘up’ i.e. from lower activity groups before FOSDEM to higher activity groups after FOSDEM while 7 contributors had a decrease in activity immediately after FOSDEM and jumped ‘down’ i.e. classified into a lower activity region.
Long Term Activity

Out of 52 contributors who attended FOSDEM 2014, 18 contributors had an increase in their long term activity after FOSDEM and jumped ‘up’ i.e. from lower activity groups before FOSDEM to higher activity groups after FOSDEM while 3 contributors had a decrease in their long term activity after FOSDEM and jumped ‘down’ i.e. classified into a lower activity region.
Overall, in both short term and long term , number of contributors who had an increase in their level of contribution activity were higher than those who had a decrease.
It is also interesting to note that :
- Only one out of nine newcomers on boarded continued contributing after the event and had low activity (<15 messages in year)
- Out of existing contributors who attended FOSDEM many seemed to have had an ‘significant’ increase in their long term contribution activity and have even jumped from lower activity levels to extremely high contribution level (>5000 messages in one year )
- In long term post FOSDEM , number of contributors in extremely high activity level (>5000 messages in one year ) is same as those in any other level and contributors are equally distributed within levels while prior to FOSDEM, it was skewed it majority of contributors in medium activity range and very less contributors in high activity range.
FOSDEM 2015
Short Term Contribution Activity of FOSDEM 2015 attendees
Find the datagrepper charts link here . The timeline is from one month before the event till one month after the event. The middle of the timeline denotes FOSDEM. While there is a decrease in activity of FOSDEM 2015 attendees during FOSDEM itself, their contribution activity has increased a lot immediately after FOSDEM as compared to just before the event.

Long Term Contribution Activity of FOSDEM 2015 attendees
The timeline is from one year before the event till one year after the event. Hence, the middle of the timeline or 12 months from the start denotes FOSDEM 2015 .

There has been a slow increase in overall activity of FOSDEM 2015 attendees over long term.
Activity of Newcomers Onboarded from FOSDEM 2015
No Newcomers were onboarded during FOSDEM 2015 😦
Patterns in User activity for FOSDEM 2015
Consistency of Contributions : How correlated is the short term activity and long term activity of a contributor ?
Correlation between short term activity and long term activity (pre FOSDEM activity) : 0.99976042499094453 P value : 1.1504582302433539e-84
Correlation between short term activity and long term activity (post FOSDEM activity) : 0.99579135469119795 P value : 1.4403938083159664e-53
- Short term and Long term activity of a contributor are highly positively correlated i.e. same behavior overall (high contribution in short term implies high contribution in long term)
- We can see relatively less correlation in post FOSDEM activity i.e. jumps in activity levels of some contributors
Correlation of contribution Activity during the event to future behavior
Correlation between event activity and Short Term Activity Post event : 0.9929294720489632 P value : 5.9819168066219279e-48
Correlation between event activity and Long Term Activity Post event : 0.99952299446342929 P value : 3.441347571962578e-77
- contributions during the event and after the event are very highly positively correlated i.e. more the contribution during FOSDEM, higher the contribution activity in future
- Especially high correlation between event contributions and long time activity – High activity contributors tend to contribute highly during FOSDEM too ?
Impact of Event on Activity : Correlation between pre and post event activity
Correlation between pre and post event Short Term Activity : 0.99386844489943016 P value : 1.7160498882448765e-49
Correlation between pre and post event Long Term Activity : 0.999993249375565 P value : 2.0398511232841224e-123
- Long term activity is very highly correlated as compared to short term activity – More impact of FOSDEM in short term as compared to long term ? but long term activity had more jumps between activity levels
Activity wise Contributor Classification of FOSDEM 2015 attendees
Short Term Activity

Out of 52 contributors who attended FOSDEM 2014, 8 contributors had an increase in their activity immediately after FOSDEM and jumped ‘up’ i.e. from lower activity groups before FOSDEM to higher activity groups after FOSDEM while 7 contributors had a decrease in activity immediately after FOSDEM and jumped ‘down’ i.e. classified into a lower activity region.
Long Term Activity

Out of 52 contributors who attended FOSDEM 2014, 12 contributors had an increase in their long term activity after FOSDEM and jumped ‘up’ i.e. from lower activity groups before FOSDEM to higher activity groups after FOSDEM while 4 contributors had a decrease in their long term activity after FOSDEM and jumped ‘down’ i.e. classified into a lower activity region.
Overall, in both short term and long term , number of contributors who had an increase in their level of contribution activity were higher than those who had a decrease.
It is also interesting to note that :
- We can see a significant increase in contribution activity over long term rather than just short term(immediate) behavior.
- In long term post FOSDEM , number of contributors in extremely high activity level (>5000 messages in one year ) is same as those in any other level and contributors are equally distributed within levels while prior to FOSDEM,there were very less contributors in high activity range.
FOSDEM 2016
Short Term Contribution Activity of FOSDEM 2016 attendees
Find the datagrepper charts link here . The timeline is from one month before the event till one month after the event.The middle of the timeline denotes FOSDEM. While there is a decrease in activity of FOSDEM 2016 attendees during FOSDEM itself, their contribution activity has increased immensely immediately after FOSDEM as compared to just before the event.

Long Term Contribution Activity of FOSDEM 2016 attendees
Just one month since the event hence no long-term analysis for FOSDEM 2016 !
Activity of Newcomers Onboarded from FOSDEM 2016
19 newcomers were onboarded during FOSDEM 2016.
Find the datagrepper charts link here .The timeline is from the ending of FOSDEM till current time(about a month afterwards). It is important to note that out of 19 newcomers onboarded during FOSDEM 2016 everyone has continued contributing post the event. While most have low contribution activity (<10 messages in a month following onboarding), three newcomers onboarded already have medium contribution activity. There has been a surge in activity about two weeks post FOSDEM but there has been no activity post that !
Needless to say, Newcomer Onboarding from FOSDEM 2016 has been a success ! However, we need more efforts to retain these new contributors.

Patterns in User activity for FOSDEM 2016
Correlation of contribution Activity during the event to future behavior
Correlation between event activity and Short Term Activity Post event : 0.99996831639782602 P value : 4.3112590423096029e-157
- Increased correlation in contributions during FOSDEM 2016 and immediately after FOSDEM 2016 as compared to FOSDEM 2015 i.e. Event activity has started to resemble short term contribution behavior more !
Impact of Event on Activity : Correlation between pre and post event activity
Correlation between pre and post event Short Term Activity : 0.9999976975958108 P value : 3.1964456239779497e-199
- Almost perfect correlation between pre and post event short term activity – Less Impact of FOSDEM 2016 in short term ?
Activity wise Contributor Classification of FOSDEM 2015 attendees
Short Term Activity
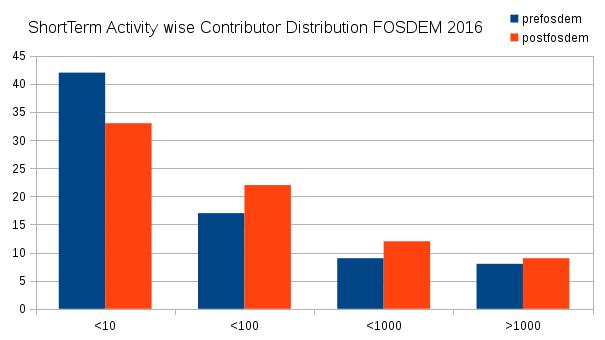
Out of 76 contributors who attended FOSDEM 2014, 19 contributors had an increase in their immediate activity after FOSDEM and jumped ‘up’ i.e. from lower activity groups before FOSDEM to higher activity groups after FOSDEM while 5 contributors had a decrease in their immediate activity after FOSDEM and jumped ‘down’ i.e. classified into a lower activity region.
While there have been greater number of jumps, the difference in their pre and post FOSDEM activities has not been much. Many of these contributors jumping between activity levels were border cases. Also, the jumps have been such that there has been an uneven distribution with more contributors having low to medium contribution activity.
Possible Future Work
- In which areas do FOSDEM attendees generally contribute ?
- Understand preferance evolution of contributors ? Has FOSDEM impacted contribution areas of attendees ? Perhaps more diverse contributions post FOSDEM ?


